Welcome to Modern Agriculture!

by Dominique P Bureau, Professor, Dept of Animal Biosciences, University of Guelph
The cost‑effective production of animal feeds that meet both animal nutritional needs and specific production objectives depends on accurately defining optimal feed specifications on a digestible or bio‑available nutrient basis. It also requires precise characterization of the nutritional composition and digestibility of the feed resources used in formulation.
Our research at the University of Guelph has consistently shown that digestibility of protein and amino acids can vary markedly between different ingredient types and even between batches of the same ingredient. In the 1990s, we documented significant variability in the digestibility of protein and the bio‑availability of amino acids in rainbow trout when fed different batches of the same feed ingredients. More recent work with fish and shrimp confirms that this variability persists across species and geographic origins.
Collaborations with the APOTEC Research Center (Ho Chi Minh City, Vietnam), Wittaya Aqua, and the University of Guelph’s Fish Nutrition Research Laboratory have revealed 5–15 % differences in crude protein and essential amino‑acid digestibility among soybean meals (SBM), meat‑and‑bone meals (MBM), and corn dried distiller’s grains and solubles (DDGS) from different origins in Nile tilapia and Pacific white shrimp (Table 1). Growth trials with the same ingredients showed that variations in apparent digestibility translated into measurable differences in amino‑acid bio‑availability, as demonstrated by strong correlations between digestible amino‑acid levels in diets and protein gain (Figure 1). These findings underscore the economic importance of ingredient batch selection, as illustrated by a simulation of tilapia production costs using SBM from various origins (Table 2).
The cause of digestibility differences among otherwise similar ingredients remains unclear, but both raw‑material origin and processing conditions are implicated. Thermal processing—drying, cooking, or toasting—is central to many feed ingredients, and heat treatment is a likely driver of the observed digestibility variation. Heat exposure can trigger a range of chemical changes, collectively termed “heat damage,” including protein oxidation, pyrolysis, amino‑acid racemisation, Maillard reactions, and amino‑acid cross‑linking. Although these reactions have been studied under controlled laboratory conditions, their relative contributions and combined effects in commercial feed ingredients are not well understood.
Maillard reactions receive particular attention because they occur at elevated temperatures and involve amino groups reacting with reducing sugars. Lysine is the most susceptible amino acid, followed by arginine. Reactive lysine is therefore used as an indicator of Maillard reaction intensity, and recent assays now allow quantification of Maillard‑reaction products.
However, Maillard reactions represent only part of the picture. Heat can also cause protein cross‑linking, forming compounds such as lysinoalanine (LAL), histidinoalanine (HAL), and lanthionine (LAN). These cross‑linked amino acids can create peptides that are resistant to enzymatic digestion, even if they remain soluble and appear digestible in vitro. Jahanbin et al. (2021) showed that higher processing temperatures reduced essential amino‑acid concentrations while increasing cross‑linked amino acids. Because these peptides may not be absorbed or utilised by animals, the nutritive value of the affected proteins is diminished. Direct assessment of amino‑acid bio‑availability is therefore essential but is typically too complex, expensive, and time‑consuming for routine industry use.
Assessing the extent of heat damage and its nutritional consequences remains challenging. Standard quality‑control methods—such as routine amino‑acid analysis—do not detect damaged or cross‑linked residues. Common in‑vitro assays, including the pepsin‑HCl degradability test, poorly differentiate ingredients with varying heat damage. Emerging techniques—pH‑stat digestibility assays, Raman spectroscopy, or direct measurement of heat‑damage markers—show promise but are not yet validated or practical for routine use.
Near‑infrared spectroscopy (NIRS) is the most widely deployed QC tool in the feed industry, yet its ability to predict the nutritive value of heat‑damaged ingredients is limited without robust, ingredient‑specific calibrations. Developing such calibrations would require extensive effort to account for the complex chemical changes associated with heat damage. Consequently, the feed industry currently lacks rapid, reliable, and practical tools to evaluate heat damage impact on ingredient quality. Such tools would enable manufacturers to estimate the digestible and bio‑available amino‑acid content of different batches more precisely, improving formulation accuracy and cost‑effectiveness.
Wittaya Aqua, APOTEC, and the University of Guelph’s Fish Nutrition Research Laboratory are actively pursuing research on this topic with support from the United States Soybean Export Council (USSEC) and other partners. We anticipate significant progress in the coming months and welcome feedback and collaboration from industry stakeholders interested in advancing this research effort.
Table 1: Summary of the results of recent digestibility trials carried out in collaboration between the APOTEC Research Center (Vietnam), Wittaya Aqua and the University of Guelph’s Fish Nutrition Research Laboratory.
Apparent Digestibility Coefficient (ADC) Crude Protein Gross Energy Arginine Lysine Threonine Nile Tilapia (trial 1) % % % % % SBM from Argentina 88 79 94 96 77 SBM from Brazil 85 83 94 98 74 SBM from USA 91 86 95 98 84 Nile Tilapia (trial 2) SBM from Argentina 85 79 93 94 84 MBM batch 1 from USA 91 80 90 93 86 MBM batch 2 from USA 87 81 91 91 77 MBM batch from Hungary 80 69 77 78 72 Pacific white shrimp DDGS batch 1 from USA 86 77 66 60 86 DDGS batch 2 from USA 80 82 74 67 87
Figure 1: Protein gain of Pacific white shrimp during a 56‑day growth trial in function of the total and digestible arginine of the experimental diets.
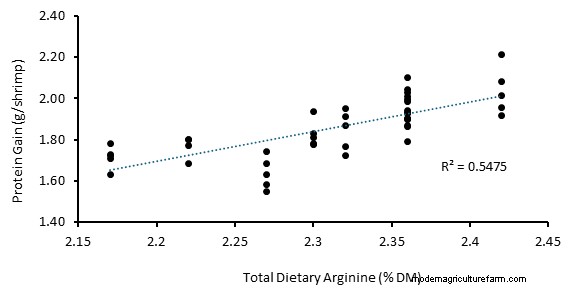
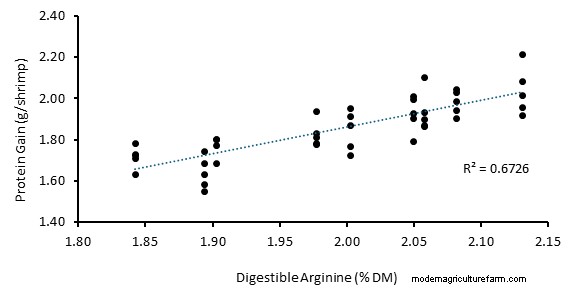
Table 2: Bioeconomic comparison of Nile tilapia production scenarios* evaluating the cost‑effectiveness of feeds formulated with soybean meal sources of varying digestibility (simulation by Wittaya Aqua on the basis of laboratory trials carried out in Vietnam)
Diet with U.S. SBM Diet with Argentinian SBM Diet with Brazilian SBM Stocking inventory 35,000 35,000 35,000 Stocking weight g/fish 30 30 30 Days of culture (DOC) days 162 167 173 Harvest weight g/fish 1,000 1,000 1,000 eFCR 1.49 1.54 1.56 Survival % 70 70 70 Production cycles per Year 2.3 2.2 2.1 Production costs Feed cost USD/Ton 756 757 758 Vaccinated fingerlings USD/Fingerling 0.175 0.175 0.175 Investment depreciation USD/year 30,000 30,000 30,000 Energy USD/day 20 20 20 Labor USD/day 30 30 30 Harvesting and processing USD/kg 0.4 0.4 0.4 Market price of whole tilapia USD/kg 2.25 2.25 2.25 Market price for tilapia fillet USD/kg 7.50 7.50 7.50 Summary at Harvest /year Harvest inventory 55,200 53,547 51,690 Harvest biomass kg 55,200 53,547 51,690 Biomass value (as whole fish) USD 124,200 120,481 116,303 Fillet yield per fish % 34 34 34 Fillet weight kg 18,768 18,206 17,575 Total Fillet value (Income) USD/year 140,760 136,546 131,810 Cumulative feed requirement kg 82,800 82,249 82,497 Cumulative feed cost USD 62,597 62,262 62,533 Cost of fingerlings at stocking USD 13,800 13,387 12,923 Cost of harvest & processing USD/year 22,080 21,419 20,676 Cost of energy, Labor and Investment depreciation USD/year 25,750 25,750 25,750 Total cost of production USD/year 124,227 122,818 121,882 Profit / Loss USD/year 16,533 13,728 9,928 Profit / Loss USD/kg 0.30 0.26 0.19 Margin % 13 11 8
*Bio‑economic modeling was conducted considering a typical IPRS production scenario, growing Nile tilapia from 30 g to 1,000 g at a water temperature of 29 degrees Celsius, with a stocking inventory of 35,000 fish (140 fish/m 3) and survival rate of 70%. The cost components are based on estimates for Colombia.